

One Economy - Two Realities
One Economy - Two Realities
Our economy consists of two different realities that sometimes merge and oftentimes for large spans of times diverge. Investors that are aware of this have a competitive edge in the market.

We’ve all heard the term - economy - at some point in our lives. The origin of the word economy can be tracked down to the greek word “oikonomia.” Oikonomia consists of the two words “oikos,” which means “household,” and “nemein,” which means “manage.” Summarized, it means something like “manage the house.”
Modern definitions of the word economy do not differ much from the basic greek concept. If we look “economy” up in the dictionary, it tells us:
“The state of a country or region in terms of production and consumption of goods and services and the supply of money.”
On Investopedia, we get the following definition:
“The large set of inter-related production, consumption, and exchange activities that aid in determining how scarce resources are allocated in a country or for a period of time.”
To sum up, the economy has something to do with production, consumption, and money.
Why two realities?
Now you’re asking - why did you say there are two realities?
Good question. Because there is a - real economy, the one that creates things and concerns itself with mining, production, manufacturing, and provides real goods and services to consumers - and the - financial economy - the one that trades and exchanges derivatives on top of the real economy.
The two realities are interrelated. The financial economy depends on the real economy. The goods that the financial economy trades and prices are based on the goods and services of the real economy.
But these two realities diverge over time.
While the real economy is tightly coupled with the productive capacity of the economies it’s residing in, the financial economy is much more volatile.
Analogy - Real and Financial Economy
Imagine you build backpacks and sell them to people. You’re able to produce 3 backpacks a day and sell them for $100 each, making a profit of $50 per backpack. At the same time, you go public with your company, and the market values your business at $100,000.
Awesome.
With the new capital, you increase your productivity and are able to hire someone to produce another 3 backpacks a day. It’s an easy calculation - your company should now be worth $200,000. The market gets excited about your company and increases its value based on assumptions and emotions to $300,000.
You’re able to grow further and are able to produce another 3 backpacks a day. The market gets even more enthusiastic and values your company at $1,000,000.
How does that make sense?
The financial economy regularly diverges from the real economy, and we can see that by looking at Price to Earnings multiples of companies or index funds.
What happens is that the market is rewarding our backpack business with lower discount rates on capital that we would need to expand our business. The higher our valuation, the easier it is to raise more money. In a paper by Fama and French 2005 - “Migration,” this process is neatly described. Our little backpack business starts as a value business with “okay” profitability, a low price-to-book ratio, and slow growth. As we’re growing our business, we’re migrating from value towards growth, our profitability increases, the price-to-book ratio is increasing, and growth is expanding.
Back to our little example. The economy is shaky, and we enter a recession. You have to cut back and produce only 6 backpacks a day now. Logically, your company should now be worth $200,000 again, but the market is overly depressed and values your company at $100,000 - that market capitalization when you only produced 3 backpacks a day.
Markets don’t act linearly. Narratives and emotions play a crucial role. In his book “Narrative Economics,” Robert Shiller described this in much more detail. Here is a summary of the key points from his book:
Narrative economics is a branch of economics that studies the role of stories in shaping economic events
Stories can influence people's expectations and behaviors, which can impact economic outcomes
Social media and other technological platforms play a role in the formation and spread of economic narratives
Policymakers can potentially use narrative interventions to address economic challenges
Our little backpack business, even though still profitable and growing, is susceptible to this narrative. If the market is depressed, it will influence investors’ expectations towards us, too - we call this “systematic risk.” Systematic and unsystematic risks are two aspects to consider when designing a portfolio. But this would be out of the scope of this article.
The Financialization of our Economy
Now zoom out and imagine this happening on a country-wide basis. The financial economy, the stock market that prices the companies, goods, and services, and the real economy that produces and offers those services.
We can measure the financial economy by looking at the stock market capitalization. Usually, we use the Wilshire 5000 Index to get a general overview of the stock market. The “5000” is a bit misleading. This index is also called the “Total Market Index" and is a market-capitalization-weighted index of the market value of all American stocks that are actively traded.
This chart shows the Wilshire 5000 vs. the US Real GDP, which is usually a measure of productivity within a country. There are other ways to measure real productivity, like:
Total Factor Productivity (TFP): The ratio of output to inputs in an economy, such as labor and capital. It’s used to compare the efficiency of different countries or industries.
Multifactor Productivity (MFP): The productivity of an economy using multiple inputs like capital, labor, energy, and materials.
Labor Productivity: The output per hour of labor in an economy. It is used to compare the efficiency of different countries or industries.
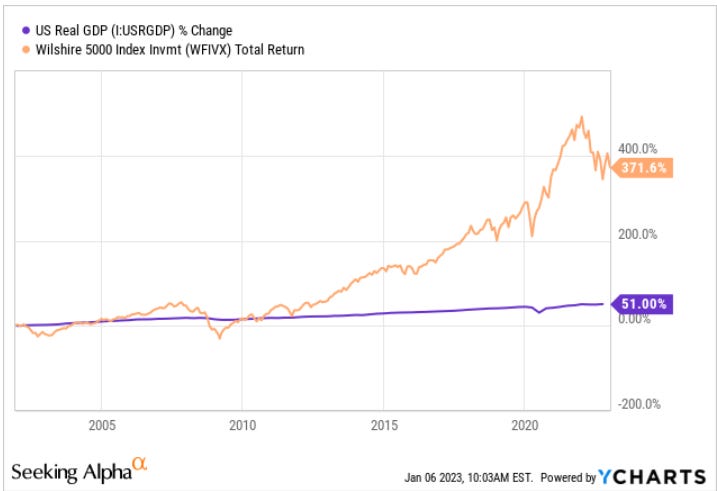
Since 2010, the financial and real economy gap has been growing. There are many reasons, and a holistic explanation would be outside of my knowledge, and the following explanation includes simplifications.
Around 2001, China entered the World Trading Organization, which allowed countries worldwide to trade and establish factories within China (and other low-income countries). Cheap labor and plenty of incentives led many companies to outsource their manufacturing to lower-income countries to increase profitability. This could be labeled as the beginning of the hyper-financialization of developed countries.
Companies’ profitability increased. At the same time, the internet and digital services started to increase in dominance within the markets. The properties of software companies like Microsoft, Uber, Snapchat, Airbnb, and Netflix are very different from companies that manufacture goods. That added to the financialization of the market.
The petrodollar and US Dollar hegemony added to the financialization. The US owns the cash printer, which led to ever-lower interest rates over time and the removal of entry barriers to receiving new capital.
All this added to the financialization. Let’s look at the long-term trend of the Wilshire 5000 to GDP ratio.
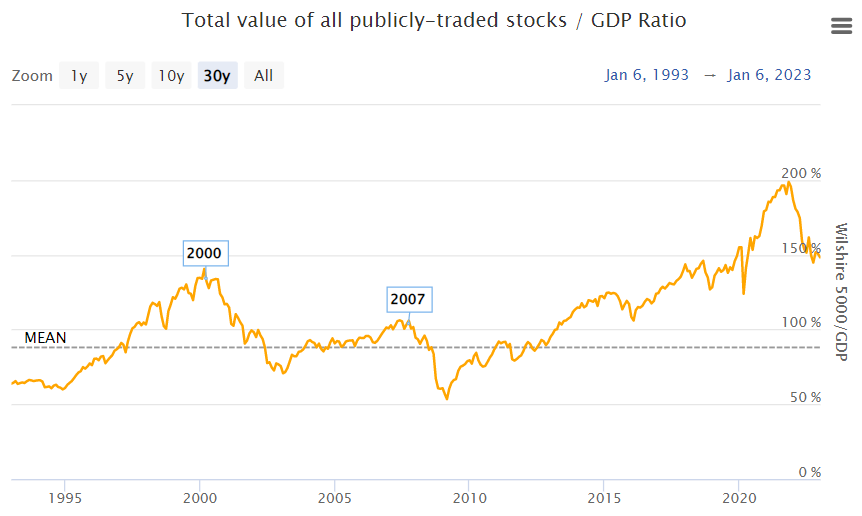
The Wilshire 5000 to GDP ratio’s historical average is around 80%. During the Covid pandemic and trillions in stimulus (cheap money), the ratio jumped to 200%!!!
Next is the S&P 500 Price to Earnings ratio. You can identify the last two equity market manias, the internet bubble in 2001/2002, the onset of the global financial crisis, and the latest Covid-induced stock market mania.

The S&P PE ratio doesn’t capture the hyper-financialization of the market, as well as the Willshire to GPD ratio. Still, it provides an excellent overview of when the stock market heats up. The S&P consists only of the 500 companies with the highest market capitalization. With the emergence of more high-profitability software companies, the PE ratio of these companies doesn’t provide a complete picture vs. the economy's productivity. The S&P PE ratio is a better "leading indicator” to predict market declines. I wrote about it in depth in this article.
Takeaway
We remain in a hyper-financialized economy and can expect more volatility in the near term. Growth stocks took a major hit after the Covid-boom, and with rising interest rates, cash flow negative companies have a tougher time raising more money to support their business.
Companies in the value territory that operate profitably, generate cash flow, and can support their business without external money supply have the edge in this environment.
99% of individual investors should not concern themselves with individual stocks and invest in index funds. A list of 10-15 index funds that cover areas like US small caps, US Small Cap value, international value, international small company, international small-cap value, emerging market, and emerging value.
If your goal is to buy and hold and you invest over 15 years, index funds reduce volatility and generate formidable returns. There is a reason why no mutual fund and only very very very (1%) of individuals can consistently outperform cheap index funds. It’s statistics. I will discuss this in a later post.